emWave® Pro Plus Tour
The following tour will give you an overview of the features in the emWave Pro Plus software. If you are a new emWave user, you may wish to familiarize yourself with the emWave Pro sections first.
emWave Pro Plus Features
1. 1-Minute HRV Deep Breathing Assessment
2. Measures
7. 1-Minute HRV Deep Breathing Assessment Procedure
8. Editing IBIs in recorded data
10. Troubleshooting and Tips for Collecting Good Data
Overview - Assessments
The emWave® Pro Plus features two heart rate variability (HRV) assessments in addition to the HeartMath® coherence-training offered by emWave Pro. Coherence training reduces stress and aids individual balance, optimal performance and personal growth. The HRV measures can be used to show autonomic nervous system response to various interventions. They also document changes in HRV over time.
The two heart rate variability assessments are:
- 1-Minute HRV Deep Breathing Assessment with age adjusted reference ranges for each HRV measure.
- HRV Assessment — an advanced tool for studying heart rate variability that can be used in a wide range of applications. It includes many of the most commonly used time — and frequency — domain variables.
Use of these features requires basic knowledge of heart rate variability, HRV variables, analysis and assessment protocols. See the Heart Rate Variability Overview section in the HeartMath Library in this program and the links to research papers provided in the reference section below. These resources provide a good introduction to HRV assessment and its applications.
The HRV assessments are conducted independent of coherence-training sessions and are tracked in a separate part of the database.
The HeartMath USB stick module Pulse Sensor is required. This USB pulse sensor samples at 370 hertz.
Watch emWave Pro Plus video tutorials online here:
https://heartcloud.com/emwaveproplus
1-Minute HRV Deep Breathing Assessment
HRV data is recorded continuously for approximately one minute while the client consciously engages in paced deep breathing at a rate of six breaths per minute, which is why this assessment is sometimes referred to as the “six breaths assessment.”
It is very important that the client breathe as deeply as he or she is comfortably able. Some people may need a practice session before completing the assessment. The 10-second breath rhythm (five seconds on the in-breath and five seconds on the out-breath) is repeated six times over the one-minute period.
This is a challenge test used to determine the maximum amount of vagally mediated (parasympathetic) HRV the client’s autonomic nervous system is capable of producing.
The ideal assessment for determining how much overall HRV a person has is to obtain a 24-hour ambulatory recording during an individual’s typical day and night. Clearly, it is not always possible or practical to obtain 24-hour recordings. We have found that the best short-term assessment with good correlations to 24-hour measures is the 1-Minute HRV Deep Breathing Assessment. This protocol has a good correlation with 24-hour measures of vagally mediated HRV and is the most stable short-term assessment in terms of test-retest variation and has good correlation to age-related declines in HRV.
Many studies have shown a clear age-related decline in the levels of HRV a person has, which is why the assessment requires a person’s age. In References below, you can read a PDF of Utenami, et al.’s paper, Twenty-Four Hour Time Domain Heart Rate Variability and Heart Rate: Relations to Age and Sex Over Nine Decades. Once the assessment is completed, the values are compared to an age matched reference database of healthy individuals in which the data was collected using the same protocol.
Because there are individual differences in healthy people’s HRV levels (how much HRV they have), stemming from differences in sex, overall health, fitness, genetics, etc., the HRV levels vary in individuals who are the same age. Therefore, the user should be informed that the reference ranges provided in the assessment are based on assessments of a large reference sample of healthy individuals.
In measures collected over time (weeks to months), clients’ HRV levels also can be affected by stress levels, getting too much or too little sleep, becoming more or less physically fit, emotional trauma or injury, becoming more emotionally self-regulated, etc.
This assessment partners well with self-regulation and HRV coherence training because they provide a way to increase the range of HRV over time, but this is primarily true in individuals who start out with lower HRV levels. Typically, as individuals practice self-regulation and HRV coherence training, their scores are likely to increase over time. In this context, small improvements can be meaningful.
Measures:
Mean Heart Rate
Mean heart rate for all normal intervals, in beats per minute.
Mean Interbeat Interval (RR)
Mean interbeat interval of all normal intervals, in milliseconds.
Mean Heart Rate Range (MHRR)
The difference between the maximum and minimum heart rate during each breathing
cycle is calculated. The result is expressed as the mean of these heart-rate
differences in beats per minute (BPM).
SDNN
Standard deviation of all normal interbeat intervals in the recording, in
milliseconds. In this assessment, the primary source of the variation is
vagally (parasympathetically) mediated activity. Low age-adjusted values are
associated with increased risk of a wide range of poor health outcomes.
RMSSD
Root mean square of successive difference (RMSSD, the square root of the mean
squared differences of successive (adjacent) normal interbeat intervals over
the entire recording period, in milliseconds. The RMSSD is a measure of vagally
mediated activity. In the context of this assessment protocol, the SDNN and
RMSSD are highly correlated with each other, but this is not the case when the
HRV is collected during other protocols.
Normalized coherence
The coherence score is a measure of the degree of coherence in the heart rhythm
pattern. A coherent heart rhythm is a stable regular repeating rhythm
resembling a sine wave at a single frequency between 0.032 - 0.26 Hz (2 -15
cycles per minute). The more stable and regular the heart rhythm frequency, the
higher the coherence score. The normalized coherence level is determined by
measuring the power spectral density (PSD) around the largest peak in the
coherence range and dividing it by the PSD total power. Normalized coherence
ranges from 0 -100.
HRV Assessment Glossary
The HRV Assessment calculates the most common HRV measures from two-minute or longer Interbeat-interval (IBI) recordings.
HRV recorded in resting conditions is a common approach to assessing HRV. The most common recording lengths used are five and 10 minutes. However, assessment can be done over any time period, depending on the research question and the assessment protocol.
Review the Assessment Considerations section below.
Measures:
The minimum recording length is two minutes. The recording lengths can be set
by the user and extended up to 99 minutes.
Time domain measures:
Time domain indices quantify the amount of variance in the interbeat intervals
(IBI) using statistical measures. Although they are the easiest to calculate,
they do not provide a means of fully quantifying autonomic dynamics or
determining the rhythmic activity generated by the different physiological
control systems. Because they are always calculated the same way, however, data
collected by different researchers are comparable, but only if the recordings
are exactly the same length of time and the data are collected under the same
conditions.
Duration
Length of the recording in minutes.
Number of RR intervals
Number of all interbeat intervals used in the analysis.
Mean Heart Rate
The mean of all normal interbeat intervals after converting to BPM.
It is important to note the natural relationship between heart rate (HR) and amount of HRV. As HR increases there is less time between heartbeats for variability to occur, thus HRV decreases. At lower heart rates, there is more time between heartbeats and variability naturally increases. This is called cycle length dependence and it persists in the healthy elderly to a variable degree, even at a very advanced age. Even in healthy subjects, the effects of cycle length dependence should be taken into account when assessing HRV. HR values should always be reported, especially when they are influenced by factors such as stress reactions, medications and physical activity.
Mean Interbeat Interval
Mean of all normal interbeat intervals, in milliseconds.
SDNN
The standard deviation of all normal interbeat intervals in the recording, in
milliseconds.
This measure reflects the ebb and flow of all factors that contribute to HRV. In short-term resting recordings, the primary source of the variation is parasympathetic mediation, especially with slow, deep breathing protocols. However, in ambulatory and longer-term recordings, the SDNN values are highly correlated with lower frequency rhythms. Low age-adjusted values are more predictive of morbidity and mortality than vagally mediated measures.
RMSSD
Root mean square of successive difference, the square root of the mean squared
differences of successive (adjacent) normal interbeat intervals over the entire
recording period, in milliseconds.
The RMSSD reflects the beat-to-beat variance in heart rate and is the primary time domain measure used to estimate the vagally mediated changes reflected in HRV. The RMSSD is correlated with high frequency (HF) power.
The vagally mediated (parasympathetic) HRV is most relevant to mental health-care professionals because it is most strongly correlated with self-regulatory capacity and cognitive functioning. This is sometimes called a measure of “vagal tone,” though HeartMath and a growing number of researchers believe the term, vagal activity, is more appropriate.
Frequency domain measures:
Analogous to brainwaves, power spectral analysis is used to separate HRV into
its component rhythms that operate within different frequency ranges. The main
advantages of frequency domain analysis over the time domain measures is that
it supplies both frequency and amplitude information on the specific rhythms
that exist in the HRV waveform, providing a means of quantifying the various
oscillations.
The values are expressed as the power spectral density (PSD), which is the area under the curve in a given bandwidth of the spectrum. The power, or height of the peak at any given frequency indicates the amplitude and stability of the rhythm at that frequency. The frequency reflects the period of time over which the rhythm cycles. For example, a 0.1 hertz frequency (heart coherence) has a cycle period of 10 seconds.
The European Society of Cardiology and the North American Society of Pacing and Electrophysiology Task Force Report on HRV (see paper titled Heart Rate Variability: Standards of Measurement, Physiological Interpretation, and Clinical Use in the Reference section) divided heart-rhythm oscillations into four primary frequency bands: high frequency (HF), low frequency (LF), very low-frequency (VLF) and ultralow frequency (ULF).
Most HRV analysis is done on five-minute segments, although other recording periods often are used. When other recording lengths are analyzed, the length of the recording should be reported because this has a big influence on HRV frequency and time domain values. The various rhythms all have specific underlying physiological sources and are associated with various, physical and mental health issues as well as the effects of stress.
Total Power (ms2/hertz)
Sum of the PSD in the range > 0 to < 0.4 hertz.
Total power is correlated with SDNN. It reflects the ebb and flow of all factors that contribute to HRV.
Very Low Frequency (ms2/hertz)†
Sum of the PSD in the range >= 0 .0033 to < 0.04 hertz, which equates to
rhythms or modulations with periods that occur between 25 and 300 seconds.
Experimental evidence suggests VLF rhythm is intrinsically generated by the heart and that the amplitude and frequency of these oscillations are modulated by efferent sympathetic activity resulting from physical activity and stressful emotions. Normal VLF power appears to indicate healthy function, and increases in resting VLF power and/or shifting of their frequency can reflect efferent sympathetic activity, especially in ambulatory recordings.
†VLF is not analyzed and reported if the recording length is less than five minutes.
Low Frequency (ms2/hertz)
Sum of the PSD in the range >= 0.04 to < 0.15 hertz, which equates to
rhythms or modulations with periods that occur between 7 and 25 seconds.
This region primarily reflects baroreceptor activity while at rest. The vagus nerves are a major conduit though which both efferent and afferent neurological signals travel between the heart and brain, including baroreflex signals. The cardiovascular system resonance frequency is a distinctive high-amplitude peak in the HRV power spectrum around 0.1 hertz. It has long been established that it is caused by a delay in the feedback loops within the baroreflex system between the heart and brain. In humans and many other mammals, the resonance frequency of the system is approximately 0.1 hertz, which also is characteristic of the coherent state.
The sympathetic nervous system does not appear to have much influence in rhythms above 0.1 hertz, while the parasympathetic system can be observed to affect heart rhythms down to 0.05 hertz (20-second rhythm). Therefore, during periods of slow respiration rates, vagal activity can easily generate oscillations in the heart rhythms that cross over into the LF band. Thus, respiratory-related efferent vagally mediated influences are particularly present in the LF band when respiration rates are below 8.5 breaths per minute (approximately one breath every 7 seconds) or when an individual sighs or takes a deep breath.
In ambulatory 24-hour HRV recordings, it has been suggested that the LF band reflects sympathetic activity. A number of researchers have challenged this perspective and have argued persuasively that in resting conditions, the LF band reflects baroreflex activity and not cardiac sympathetic innervation. (In References below, you can click on PDF to read the article, Heart Rate Variability: New Perspectives on Physiological Mechanisms, Assessment of Self-Regulatory Capacity, and Health Risk.)
During periods of increased cardiac coherence or resonance, there typically is an increased range of variability in both blood pressure and heart rate, which is detected as increases in the rate of change by the sensory neurons, resulting in increased firing rates, which increase vagal afferent traffic. There also is a more ordered pattern of activity. Regular practice of HRV biofeedback results in lasting improvements in baroreflex gain independent of cardiovascular and respiratory effects, indicating neuroplasticity within the baroreflex system, likely within the intrinsic cardiac nervous system.
High Frequency (ms2/hertz)
Sum of the PSD in the range >= 0.15 to < .4 hertz, which equates to
rhythms with periods that occur between 2.5 and 7 seconds.
This band primarily reflects parasympathetic or vagal activity and is frequently called the respiratory band because it corresponds to the HR variations related to the respiratory cycle known as respiratory sinus arrhythmia. The mechanisms linking the variability of HR to respiration are complex and involve both central and reflex interactions. The RMSSD time domain measure is highly correlated with HF power.
Low Frequency/High Frequency ratio
The ratio of LF power to HF power.
The LF/HF ratio should be interpreted with caution and the mean values of HF and LF power taken into consideration. For example: A high LF/HF ratio may indicate higher sympathetic activity relative to parasympathetic activity, as can be observed when people engage in meeting a challenge that requires effort and increased sympathetic activation such as physical activity or stress. It also can indicate increased parasympathetic activity such as that which occurs during slow breathing and during the coherent state, when the respiratory rate moves down in frequency and moves into the LF band.
Normalized Coherence
The coherence score is a measure of the degree of coherence in the heart rhythm
pattern. A coherent heart rhythm is a stable regular repeating rhythm
resembling a sine wave at a single frequency between 0.032 - 0.26 Hz (2 -15
cycles per minute). The more stable and regular the heart rhythm frequency, the
higher the coherence score. The normalized coherence level is determined by
measuring the power spectral density (PSD) around the largest peak in the
coherence range and dividing it by the PSD total power. Normalized coherence
ranges from 0 - 100.
Assessment analysis option: The recording length can be adjusted to any desired number of minutes.
Assessment Considerations
It is a good idea to have an extra ear sensor and a finger sensor available in case it is difficult to obtain a good pulse signal with the ear sensor because of poor circulation, an earlobe that is too small or ear piercings.
For resting HRV assessments, the client typically is seated in a comfortable
chair, though some protocols have the client lying down. When the client is
seated, the backrest should be tilted at a slight angle, but no more than 15
degrees, which is just enough to be comfortable without causing drowsiness.
The feet should be able to comfortably reach the floor or be planted on a
footrest. Any location that is relatively quiet and free of distractions will
work. The location and temperature should be comfortable, not too warm or cold.
Avoid completely closed-off, small and empty areas that can produce a
claustrophobic feeling in some individuals.
Within at least one hour before the assessment, the client should not have engaged in heavy aerobic exercise, or consumed coffee, tea or other caffeinated beverages. Cigarettes should not be smoked within a minimum of 30 minutes before the assessment. Measurements should not be taken for at least 1½ hours after a heavy meal. It is best to take repeated measures at the same time of day to avoid circadian variation in heart rate and HRV.
Excessive movement may result in artifacts, which will produce unusable readings or extra editing. Make sure the client is comfortable to avoid increased muscle tension in the head, neck and shoulders if the ear sensor is used, or in the arms and hands if the finger sensor is used. Explain to the client that excessive movement may result in artifacts and ask him or her to sit quietly without talking, falling asleep, crossing legs or making unnecessary movements.
Clients should not read printed materials or engage in intense mental activity. It is preferable that they keep their eyes open for resting HRV assessments. When interpreting results, take into consideration that medications, especially those that affect autonomic functioning, can alter HRV and assessment results.
References
Marek Malik, et al. “Heart Rate Variability: Standards of Measurement,
Physiological Interpretation, and Clinical Use.” European Heart
Journal 17.3 (1996): 354-381. PDF
Fred Shaffer, Rollin McCraty, and Christopher L. Zerr. "A healthy heart is not a metronome: an integrative review of the heart's anatomy and heart rate variability." Frontiers in Psychology 5 (2014). PDF
Rollin McCraty and Fred Shaffer. "Heart Rate Variability: New Perspectives on Physiological Mechanisms, Assessment of Self-Regulatory Capacity, and Health Risk." Global Advances in Health and Medicine 4.1 (2015): 46-61. PDF
Ken Umetani, et al. "Twenty-Four Hour Time Domain Heart Rate Variability and Heart Rate: Relations to Age and Sex Over Nine Decades." Journal of the American College of Cardiology 31.3 (1998): 593-601. PDF
Resources
HeartMath health
professional resources
HeartMath
Institute Research Library
Navigating the Software
New User creation or selection
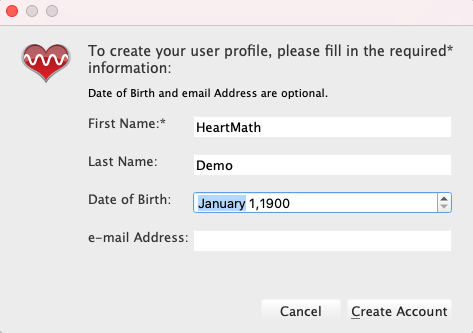
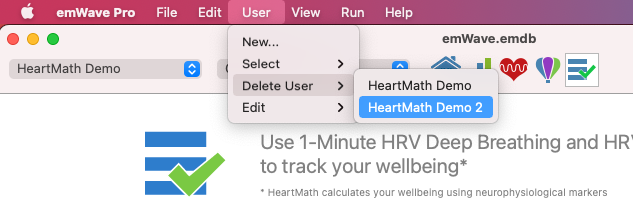
Create a new user for the client via the User menu, New item.

Note: When creating a new User, you will be given the option to set up a HeartCloud™ profile. This option can be suppressed permanently by going to Preferences, the Advanced tab and unchecking “Always prompt new user for HeartCloud.”
Enter name or personal identifier code or PIN, date of birth and sex. Then click the “Create Account” button.
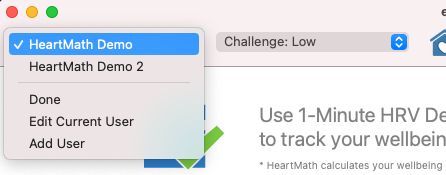
If the user already exists, select the existing user name from the User menu, or select the name in the drop-down list.
Assessment Home
Using the main selection icons at the center of the toolbar, click on the Assessments icon on the right.

For first-time use by the selected user, the wizard will show a pop-up window to review user information. If necessary, you may make changes.
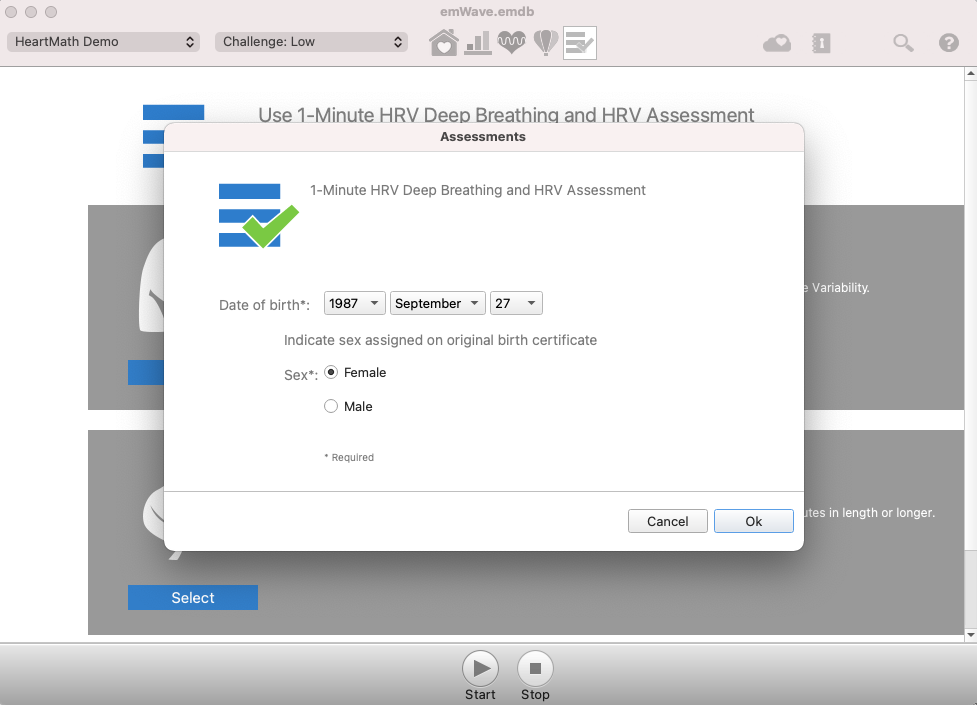
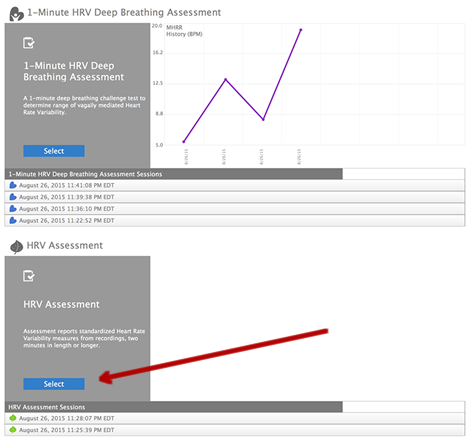
The assessment selection screen lists the two HRV assessments:
“1-Minute HRV Deep Breathing Assessment” and “HRV
Assessment”.
Press the “Select” button for the assessment you want to run.
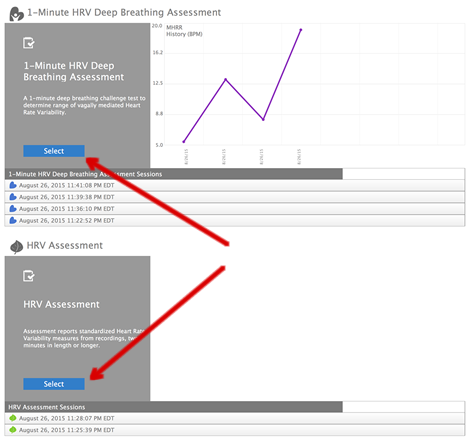
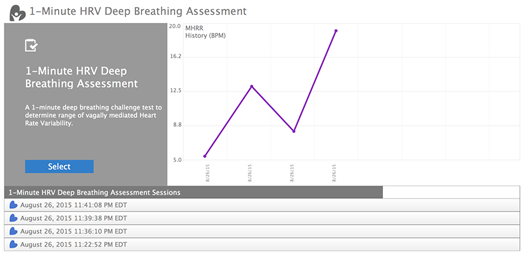
The assessment selection screen lists all of the 1-Minute and HRV Assessment sessions that have been conducted in the past, if any, for the selected user. Click on one of the rows with the previously recorded session date and time to bring up an individual assessment session for review, editing, deletion or saving the session report to a PDF. The purple line graph in the 1-Minute section of the screen plots the MHRR values from previously recorded 1-minute deep-breathing sessions.
1-Minute HRV Deep Breathing Assessment Procedure
Connect the ear sensor to the client’s earlobe and the strain relief clip to his clothing. If the earlobe is too small or has too much jewelry, use the finger sensor. See below for additional sensor troubleshooting information.
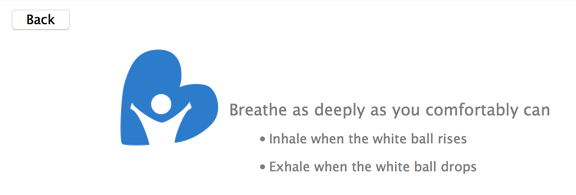
Client instructions: Sit up straight and comfortably. For the next 60 seconds, until the assessment is complete, inhale and exhale as deeply as you comfortably can to get maximum respiratory capacity. Do this while following the breathing pacer shown on the screen: Inhale for five seconds, and exhale for five seconds. For first-time users, it is good to start with a practice session because it may take some time to become familiar with a slower and deeper breathing rhythm.
Start the session by clicking the Start button at the bottom center of the screen. The session will stop automatically at the end of the preset time.
The program will begin calibrating. Once calibrated, the breathing pacer will begin to advance to indicate the breathing pattern. When this phase is complete, the breath pacer resets to the beginning and proceeds with the assessment. Observe the client’s breathing pattern to make sure that she is breathing deeply.
Check the pulse wave display, which should look similar to the rhythm in the figure at right. There can be significant variations in the shape and amplitude of the pulse wave.

Following the calibration, the user is prompted with a plot of a rising and lowering ball to help pace the breathing. The HRV waveform also is plotted.
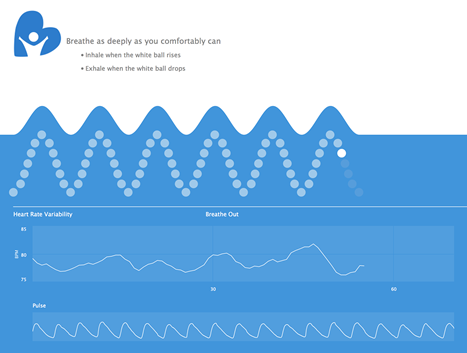
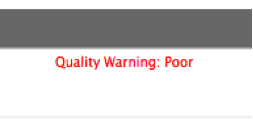
When the session is complete, look in the upper-right corner of the screen and check whether there is a data quality warning. The warning can occur because the client did not take six breaths during the test. If that’s not the issue, check the sensor placement and rerun the assessment. See the troubleshooting section below to learn about getting good data for a more thorough procedure.
Click on the Report button to view the session report, or the Edit button to edit the session data.

Editing IBIs in recorded data
When the assessment is complete, you will have an opportunity to click on the Edit button to go to the session data-editing screen. Circled red x’s indicate invalid data points that were automatically identified and designated by the program. If there are other invalid data points, click on them to remove them from the analysis. All removed data points will remain visible on the session edit screen. Click on the Save button when editing is complete. Click the Cancel button if no editing is needed.
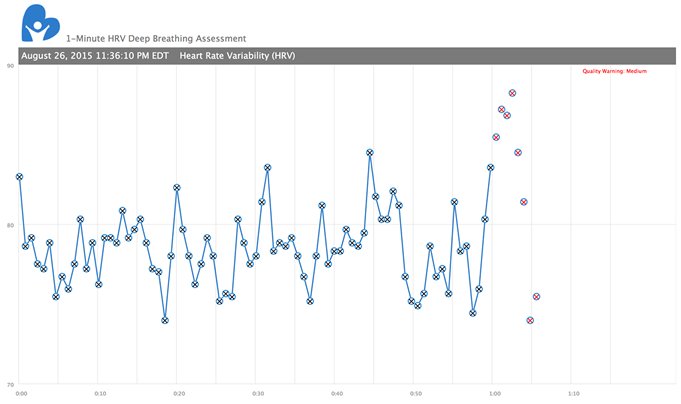
Data points removed from an analysis can be added back into it by clicking on them in the session data-editing screen.

If there are a significant number of invalid data points, the assessment should be redone. Review the troubleshooting section below for ways to rectify the cause of the invalid data points.
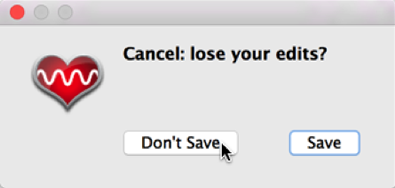
You can cancel edits so no changes are saved by clicking the Cancel button while editing. Then click “Don’t Save” in the pop-up window.
Click on the Report button to view the report. The report also can be saved to a PDF file via the Save as PDF button.
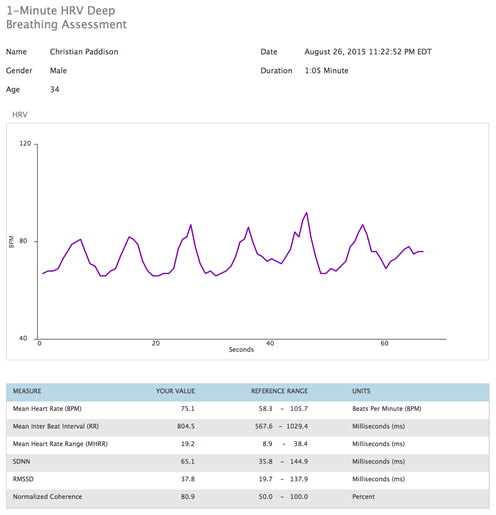
Click the Close button when you finish viewing the report.
Return to the assessment selection screen by clicking on the Back button at upper left.
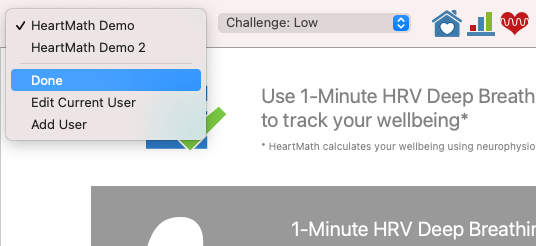
When you have completed your work with the client, you can choose "Done" in the list of clients, and the program will switch to the HRV session screen with “Select User” displayed in the user selection field.

HRV Assessment Procedure
Click on the Select button under HRV Assessment.
Set the desired number of recording minutes from 2 to 99. If the selected length is less than five minutes, the VLF frequency domain measure will not be not provided. If you’re going to do follow-up sessions for comparison to previously recorded sessions, they should be the same length.

Click on the Start button to begin the assessment. The session will stop
automatically at the end of the preset time.
The blue circle indicates the amount of time remaining in the assessment.
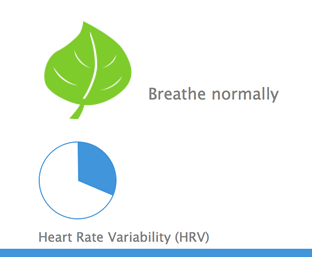
The HRV pattern is displayed on the screen. Check the pulse wave display to make sure you’re getting good quality data.
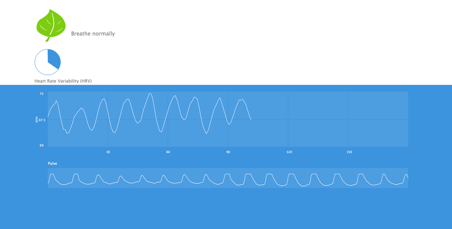
Once the session ends, click on the Report button to view the session report, or the Edit button to edit the session data.

Editing IBIs in recorded data
When the assessment is complete, you will have an opportunity to click on the
Edit button to go to the session data-editing screen. Circled red x’s
indicate invalid data points that were automatically identified and designated
by the program. If there are other invalid data points, click on them to remove
them from the analysis. All removed data points will remain visible on the
session edit screen. Click on the Save button when editing is complete. Click
the Cancel button if no editing is needed.
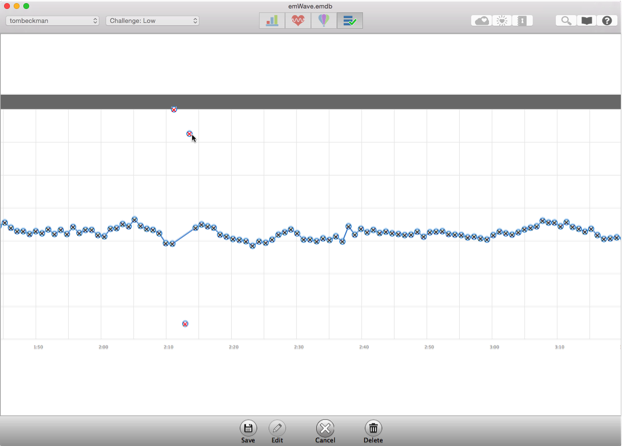
Data points removed from an analysis can be added back into it by clicking on them in the session data-editing screen.
If there are a significant number of invalid data points, the assessment should be redone. Review the troubleshooting section below for ways to rectify the cause of the invalid data points.
You can cancel edits so no changes are saved by clicking the Cancel button while editing. Then click “Don’t Save” in the pop-up window.


Click on the Report button to view the report, or the Edit button to edit the session data.

Click on the Report button to view the report. The report also can be saved to a PDF file via the Save as PDF button.
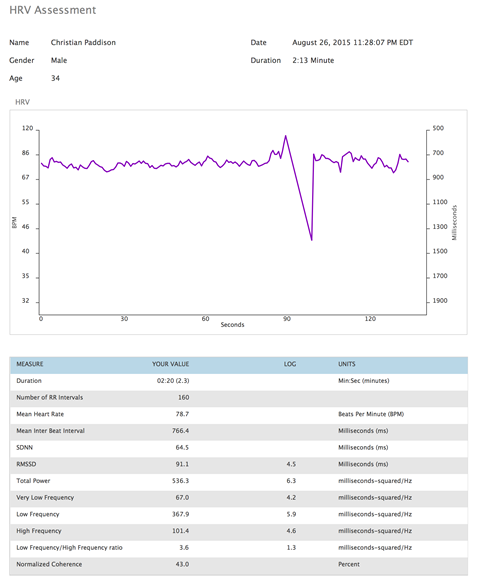
Click the Close button when you finish viewing the report.
Return to the assessment selection screen by clicking on the Back button at upper left.
When you have completed your work with the client, you can choose "Done" in the list of clients, and the program will switch to the HRV session screen with “Select User” displayed in the user selection field.


Troubleshooting and Tips for Collecting Good Data
If you are having trouble getting a good pulse (see examples at right) or HRV data recording from a client, the following troubleshooting tips can help ensure you get an accurate recording.
Example of a good pulse wave:

Try adjusting the sensor on the earlobe, switching to the other earlobe or try a finger sensor, if you have one.
Example of a weak pulse wave:

The next example shows a good pulse signal, but movement artifacts are present. Notice in the pulse wave screen that some of the waveforms are high-quality pulse waves, but they are followed by an erratic waveform pattern. This would suggest that the client is moving too much. This waveform is typical of movement artifacts. Advising the client to keep his or her head or hand still, depending on which sensor is used, likely will solve the problem.

This is another example of a poor quality signal. The pulse wave is erratic. It also has small bumps in it. Not only are some of the deflections too close together to be pulses, but the space between them is too wide in other parts of the tracing. The sensor is not picking up this person’s pulse.
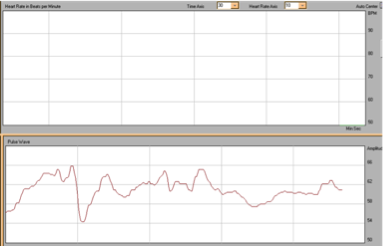
This example shows three normal beats followed by a long pause. This likely was because of a preventricular contraction (PVC), which is a type of arrhythmia. Many people have a few of these PVCs each day. It should be noted that to accurately identify an arrhythmic event or types of arrhythmia, the ECG signal has to be recorded. The emWave Pro Plus software does not record the ECG.
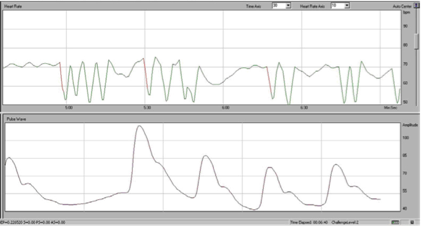
Examples of the various types of pulse recordings that are possible cannot all be shown here, but consider the following important information about atrial fibrillation, a common type of heart arrhythmia: Atrial fibrillation can result in regular missed or extra beats every fourth or fifth beat, or a skipped beat in repeating patterns. In some forms of atrial fibrillation, clusters of irregular beats are interspersed with short pauses. Occasionally the pauses are a little longer. HRV assessments cannot be conducted if clients have atrial fibrillation or another consistent arrhythmia that cause abnormal sinus rhythm during assessments.
Ask the client if he has consumed a large amount of a caffeinated beverage in the last few hours because this can induce temporary heart-rhythm disturbances. Other substances such as nicotine, alcohol, cocaine, inhaled aerosols, diet pills and cough and cold remedies also can cause disturbances. Additionally, emotional states such as shock, fright and stress can cause irregular heart rhythms.
If clients have frequent skips or extra beats, or other types of irregular rhythms, it would be prudent to suggest they consider seeing their physicians for testing, unless they and their physicians already are familiar with these. It is wise, of course, to err on the side of caution. To avoid undue alarm, assure clients that any previously unnoticed arrhythmias “typically” are not clinically significant.
Pacemakers
Some people you encounter, especially older patients who may or may not have types of heart problems not noted here, may have pacemakers. Pacemakers are electronic devices that are set so the heart rate does not drop below a certain level. Although they can do lots of things to speed up the heart rate, a lower limit is set in each individual’s pacemaker to match his or her needs. The most common setting for the lower rate is 60 beats per minute.
If your client has a pacemaker and spends significant time pacing at the lower rate, there will be no variability in heart rate, so the line will be flat on top even though the pulses will look normal in the lower panel. That’s because the pacemaker triggers the client’s heartbeats, which then cause pulses; that is exactly what happens with a typical person who does not have a pacemaker. HRV analysis is only applicable to naturally conducted interbeat intervals; recordings of paced intervals should not be analyzed.
Sensor positioning tips
Make sure the ear sensor cable is securely connected to the emWave USB module. The male connecter on the ear or finger sensor cable should be fully inserted into the female connector on the USB module.
The ear sensor should be attached directly to the earlobe. The ear sensor detects your pulse more easily if the ear is warm. If the earlobe feels cool, have the client gently rub it between his thumb and index finger to improve circulation.
- Remove all earrings.
- Minimize movement or talking.
Always use the lapel clip so the entire weight of the device’s cable does not dangle from the client’s ear. Attach the lapel clip to clothing, leaving enough slack so the head can move without tugging on it.
You may need to move the sensor to another part of the earlobe or to the other earlobe to get a good reading.
Another option is to use the finger sensor for a client whose earlobe is too small.
Technical tips:
We recommend using sensors and connectors that are purchased together.
Make sure the sensor is clean. Something as simple as a buildup of skin oil on
a sensor window could create a problem. Use only a couple of drops of
alcohol on a soft cloth to wipe the inside parts of the sensor. It is
critical that the cloth is not dripping wet; any liquid that gets into
the sensor can damage it. Carefully clean the sensor between clients.
The USB module will work best when it is plugged directly into a computer, rather than a USB hub.
Disclaimer
Use of emWave products, exercises and assessments are intended as tools for stress reduction, individual balance, optimal performance and personal growth. Although these products and exercises are believed to be very safe and potentially very beneficial, no medical benefits or cures are expressed or implied. These products and exercises are not intended to be used as or in lieu of any medical or psychological treatment.
HeartMath is a registered trademark of the HeartMath Institute. emWave is a registered trademark of Quantum Intech, Inc. HeartCloud is a trademark of Quantum Intech, Inc.
Related Links:
emWave Pro Plus Video:click here for video
HeartMath Institute HRV Video:https://www.heartmath.org/hrv
HeartMath:https://www.heartmath.com/
Last Updated: 2025-10-08 ( Remote )
Copyright © 2025 HeartMath, Inc. All rights reserved.
HeartMath is a registered trademark of Quantum Intech, Inc. For all HeartMath trademarks go to: www.heartmath.com/trademarks