The following tour will give you an overview of the features in emWave Pro software. It also describes how to connect the hardware and how to interpret the feedback.
After installing, follow these steps:
2. User Accounts and HeartCloud
3. Plug the USB module into a USB port on your computer
4. Connect the ear sensor to your ear.
5. Start a session and confirm an accurate pulse is being collected.
10. Sync emWave2
11. Preferences
1. Understanding Coherence
Before using the emWave software it is highly recommended that you take a moment to review Coherence.
The Quick Coherence Technique helps you create a coherent state that uses the power of your heart to balance your thoughts and emotions, helping you to achieve a neutral, poised state for clear thinking. It is a powerful technique that helps you release stress, balance your emotions and feel better fast. You will be able to see your heart rhythms change as you become coherent using the emWave software.
Click here for detailed information on Coherence.
2. User Accounts and HeartCloud
emWave Pro allows multiple user accounts.
From the Progress view, click the Set Up HeartCloud button and enter your email.
Click here for more information on HeartCloud.
3. Plug the USB module into a USB port on your computer
Connect the sensor cable to the USB module and plug it into an available USB port on your computer. Make sure the sensor cable is securely connected to the USB module. Ensure that the post on the sensor cable is fully inserted into the USB module and that the USB module is also securely plugged into a USB port on your computer.
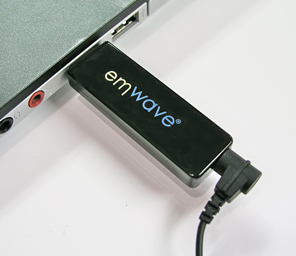
Immediately after the emWave Module is connected to a USB port, 3 lights (Red, Green, Blue) at the end next to the sensor plug will quickly flash indicating a successful internal test. If these lights do not flash, your Module may not be recognized. If so, try unplugging and reconnecting or try a different USB port on your computer.
4. Connect the ear sensor to your ear
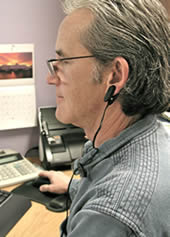
Remove any earrings (if applicable) and clip the ear sensor to your earlobe and the lapel clip to your clothing. Slide the lapel clip along the wire to a comfortable position. You might have to reposition the sensor on your ear to get accurate pulse detection. The ear sensor should be attached directly to your earlobe. The ear sensor detects your pulse more easily if your ear is warm. You can warm your ear by briefly holding it with your warmed fingers before clipping on the sensor.
5. Start a session and confirm an accurate pulse is being collected
After properly connecting the ear sensor, click the Start icon located at the bottom of the screen.
Wait for the sensor to calibrate, if you are using the emWave2 Handheld device the pulse LED on the device will begin to flash blue indicating a pulse is detected. If the pulse LED is red or unlit, reposition the ear sensor until it flashes blue. In emWave Pro you should see a pulse graph showing how well your pulse is being read.
For best results getting a reading, please be still and quiet. Talking or moving reduces the accuracy of the sensor. Taking a few deep breaths before attaching the ear sensor may help you to relax and get a good reading. If you are seeing red lines (artifacts) in your heart rhythm pattern, adjust your sensor until your pulse wave data shows distinct, smooth wave forms. You may need to move the sensor to another part of your earlobe to get a good reading. After repositioning the ear sensor, it may take a few seconds to register your pulse.
To stop the session simply click the Stop icon.
After stopping your session your data is automatically saved.
6. Record Session View
The toolbar at the top of the screen includes icons as described below:

On the left, two drop-down menus allow you to:
- Select, edit or add a user.
NOTE: At the bottom of the drop-down menu, we have provided a “Done” option. This feature is provided for practitioners to avoid recording for the wrong user. If you always set it to “Done” when you’re finished recording sessions, the next user won’t be able to record a session (or view sessions) until a user has been selected. - Specify the challenge level and set default challenge level. See additional Challenge Level information below.
The center contains the icons which switch between the three views:
- Review Progress
- Record Session
- The Balloon Icon launches the menu to access Games, Coach, My Inspiration and Visualizers
On the right there are six more icons that are described below, press once to open:
- HeartCloud – is available if you have a HeartCloud user account set up, you are logged in and you have internet connectivity.
- Journals
- Session Information
- Library Window
- Help Window
The bottom status bar displays session information:

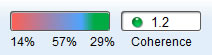
- Your Cumulative Coherence Ratios for the session in a color bar.
- The Coherence Score.
- Achievement Score. This is the sum of your individual Coherence Scores during the length of a session.
- The session time.
- Your current heart rate will display while you are running a session and your average heart rate will display when you press stop.
In addition there are control icons:
- Start session
- Stop the session
- Sound On/Off
Note that you can also change, enable or disable your sounds and their relative volume in the Preferences panel.
The application will always open ready to record a session.
After the sensor has calibrated your pulse, the following screen shows your session in Record Mode. This window is divided into several panes displaying different graphs and information of your current session, either while recording or reviewing.
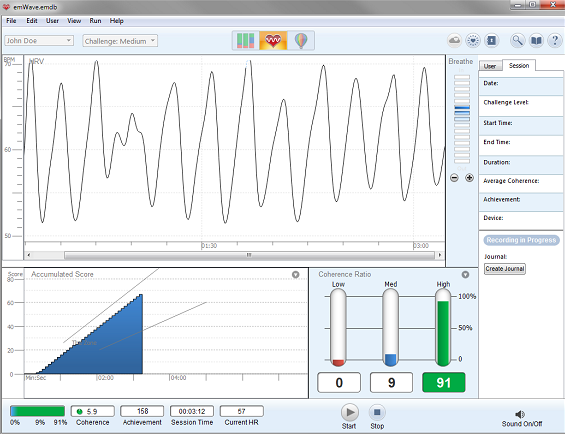
The top graph is reserved for displaying Heart Rate Variability, or HRV.
The bottom left and right views can be set to display the following:
- Accumulated Score displays the Accumulated Coherence or Zone score.
- Spectrum Average (available while reviewing a Session).
- Power Spectrum (available while running a Session).
NOTE: For additional information on interpreting the Power Spectrum, click here. - Coherence Ratio displays on the bottom right. This is a summary of the amount of time, as a percentage of the total session length, in each of the three Challenge Level ranges. This score will be affected by your challenge level settings.
- Pulse.
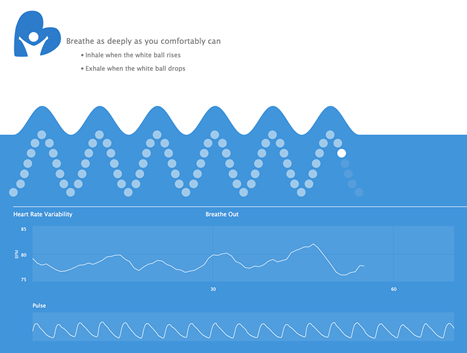
The Breath Pacer appears to the right of the HRV display.
- You can toggle the Pacer display through the View menu by selecting Show Breath Pacer or Hide Breath Pacer. If you prefer you may use the shortcut keys. On Windows, press the Control key, Alt, and the letter P. On Mac, press the Command key, Option, and the letter P.
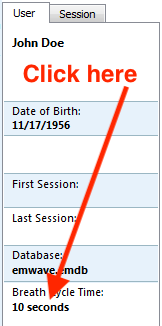
- The default breath cycle time is 10 Seconds. To increase the cycle time of the pacer while running a session, press the + icons in the pacer. To decrease the cycle time press the – icon.
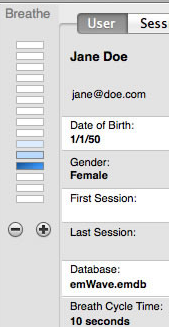
- You can see your cycle time on the User tab in the Inspector. If you hover your mouse pointer over the time in the Inspector, it says “Press to reset” where you can set a comfortable pace.
- The cycle time settings is saved for each user.
A small window comes up that allows you to adjust the breathing pace.
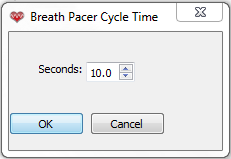
Breathe in and out with the Breath Pacer to improve the inner balance between your mind and heart!
Challenge Levels
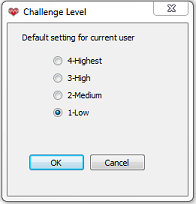
We recommend that you leave the Challenge Level on the default setting Challenge Level – Low, for your first few sessions. When you can consistently keep the Coherence Ratio in the green, then you may want to increase the Challenge Level. There is a 15% higher degree of challenge between Challenge Levels: Low and Medium and an additional 15% between Challenge Levels: Medium and High. However, between Challenge Levels High and Highest, there is a 30% higher degree of challenge. To change the Challenge Level, select the User that you wish to use. Click on the drop down arrows next to the the Challenge Level
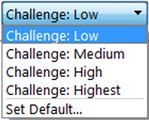
To set a new default Challenge Level, select Set Default and choose the Challenge Level you wish for all future sessions.
Viewing your heart rhythm pattern during a session will show you a great deal about your internal physiological state. It contains a tremendous amount of information about the constantly changing state of your autonomic nervous system. Ultimately the heart rhythm pattern itself offers you even more information than your numerical Accumulated Coherence Score.
With regular use, you will be able to look at your heart rhythm pattern displayed within the HRV Graph, and visually identify when you are in low, medium or high coherence. With time, you will be able to recognize your coherence patterns.
A nice, smooth, coherent heart rhythm pattern looks similar to the image in Example 1:
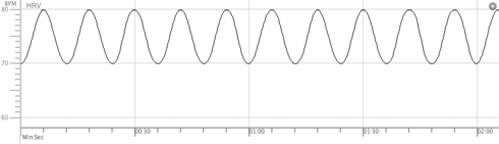
Example 1: Nice Smooth Coherent Heart Rhythm Pattern
In many situations, good physiological coherence will not result in this exact waveform. It may look more like the graph below in Example 2.
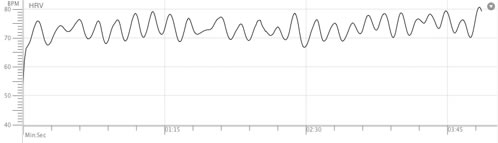
Example 2: A Coherent Heart Rhythm Pattern
A coherent heart rhythm pattern is easy to distinguish from a pattern that is incoherent.
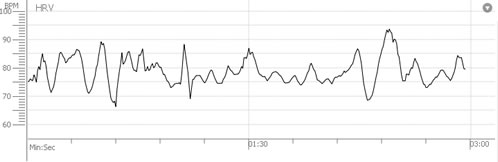
Example 3: An Incoherent Heart Rhythm Pattern
As you practice the Quick Coherence technique and become more coherent, the line should gradually change from an incoherent pattern to a coherent pattern.
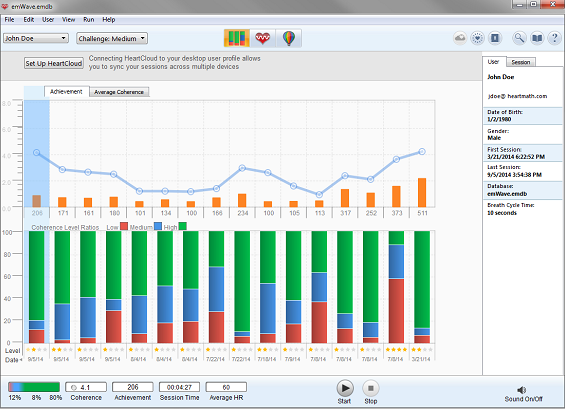
The coherence ratios present a continuously updated view of your physiological coherence ratios and current coherence score during a session. The information is updated every five seconds in correlation with your heart rhythm pattern. As the data is continuously added, the software averages the ratios and updates the graph throughout the session. After stopping the session or in Review Progress, the coherence ratios reflect the average ratios of coherence over the entire length of the session.
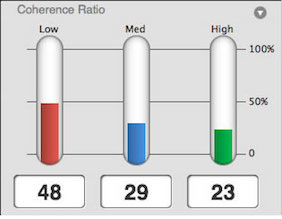
The coherence ratio graph is divided into three coherence levels: low, medium and high coherence. The total of the low, medium and high coherence scores will always equal 100%. The coherence ratio bars show how much time you have spent in low, medium and high coherence during your session. The goal is to improve your ratio in medium and high coherence. With regular practice, your ratio in high coherence will improve and your ability to remain coherent when not recording a session will increase.
The three coherence lights reflect your coherence score for the most current 5 seconds of data, and are updated every 5 seconds.
In the image above you can see the amount of time spent in each coherence level.
- Red is “Low Coherence”
- Blue is “Medium Coherence”
- Green is “High Coherence”
Ideally, you will want to be in high coherence closer to 100% of the time, when there would be the most green visible.
The heart rate display reflects the average heart rate for the most current 5 seconds of data. Every 5 seconds the application averages your heart rate and displays that average.
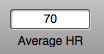
Once you end your session the average heart rate for the entire session is shown.
Remember to improve your coherence ratios by practicing the Quick Coherence Technique. Click here to review.
On the Journal tab, you can add, edit or delete Journal entries to document your journey and moods. Use the + icon to add new entries. Click in the edit box to the right of your entry to add text.
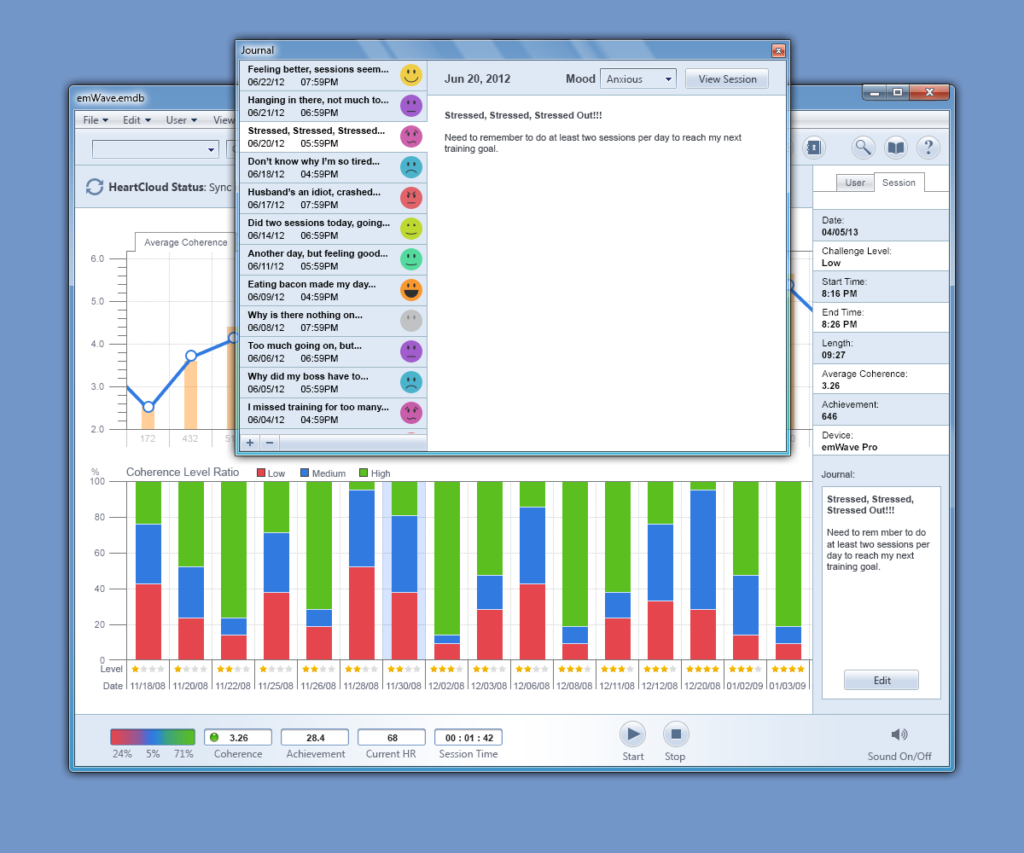
Choose the emoticon that matches your mood. If you do not select an emoticon, it will display as a gray icon.
7. Review Your Progress
Selecting the Review chart icon on the toolbar shows you the “Review Progress” view where there is a summary of all your sessions. You can mouse over the sessions, and the bottom status bar will show a summary of each session and the information on the right of the screen will give you the date, time, level and journal entry for that session.
Double clicking on a session will open it in the detail view. You can “Replay the Session” by clicking on Replay HRV Session located in the Run menu.
To delete sessions, simply highlight the session to be deleted, click Edit on the menu then choose Delete the selected session. The session is now permanently deleted.
8. Coherence Building Tools
Games, Coach, My Inspiration and Visualizers
To enhance your training experience and make it more fun, you can select the balloon icon on the toolbar to see the coherence building tools and games.
This screen shows you the available coherence training options within the application. Clicking on the individual item will open that option.
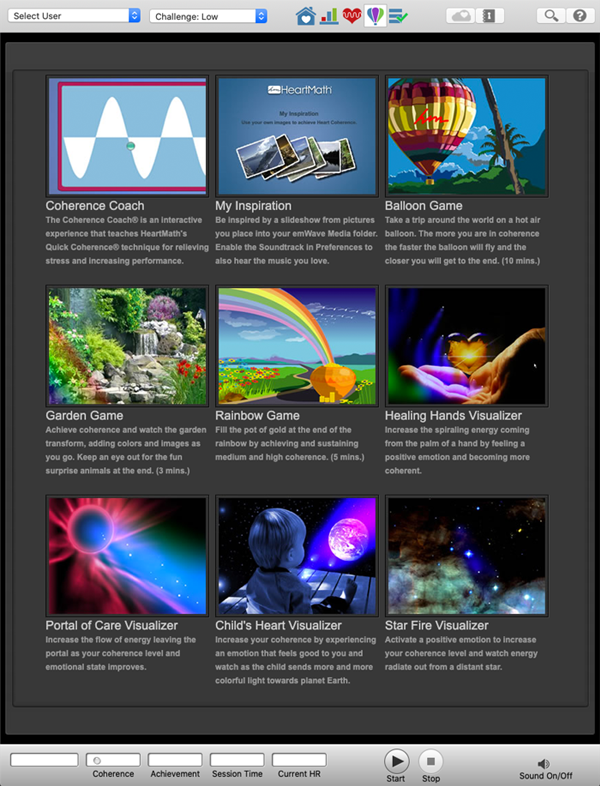
Once you are running a coherence building tool, you can switch back and forth between windows. However, if you start your recording from the session view, you cannot start a coherence building tool. To run one of these options you must start the session from the tool view.
After a session has completed, return to the standard session window by clicking the — Record a Session icon.
My Inspiration
For a personalized way to reach coherence, you can add your own pictures and music that help you reach coherence.

To add your pictures:
From the View menu, choose Media Folder. Copy your inspirational images to this location. File types that you can view include jpg, bmp and gif file formats.
To add your music:
The My Inspiration Game can use a custom soundtrack. Open Preferences and click the Sound tab to select the music file you want to play. Click on the “7 minute song.mp3” and browse your computer’s music files. The music file must be in the MP3, WAV or WMA audio format to run. You may click Preview to confirm that the music is playing your choice. Click OK to save your changes.
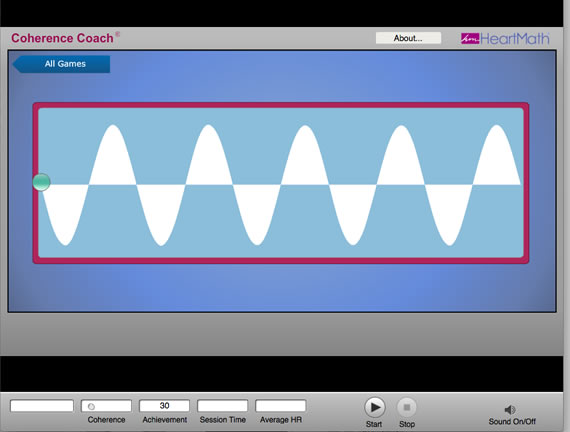
Coherence Coach®
The Coherence Coach teaches you the Quick Coherence Technique through guided instruction. The Coherence Coach is a wonderful gateway tool to begin with, especially if this is a first time HeartMath experience.
9. Assessments
NOTE: emWave Pro Plus Users Only
emWave Pro Plus Includes two heart rate variability (HRV) assessment features to the coherence training activities for stress reduction, individual balance, optimal performance and personal growth. These HRV measures can be used to show autonomic nervous system response to various interventions, and document changes in HRV over time.
Click here to read more about Assessments in emWave Pro Plus.
10. Sync emWave2 Session Data with emWave Pro
In order to see your session data from your emWave2 displayed in emWave Pro, you must sync the emWave2 Handheld Device with your computer. Be sure to start by selecting the User account in emWave Pro that matches the User of the emWave2 unit, before you sync.
Click here for complete instructions.
11. Preference Settings
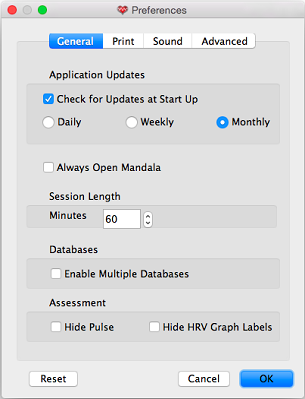
General
General settings such as how often would you like to check for software updates, Session Length and Enable Multiple Databases are found here:
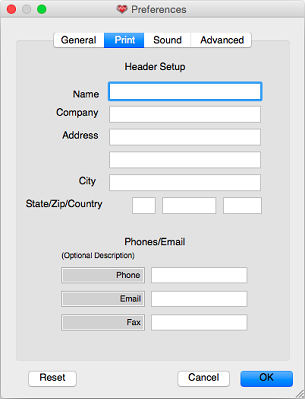
The information entered here, is displayed as individual header information when printing session data. This information can be edited or deleted at any time prior to printing the session. The information entered here will print on all printed reports for all the users in the database.
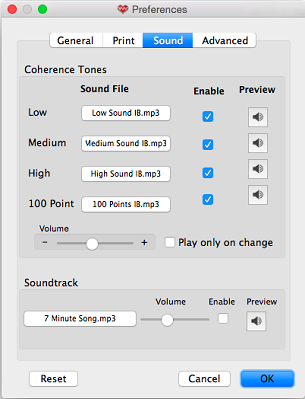
Sound
Sound effects and soundtrack can be adjusted here. You may preview and select the tones you want to hear for each coherence level, you can enable them individually, and also control the volume. You may also elect to only play them when your coherence level has changed. If you choose to enable a soundtrack to play during your session, note that the games will turn off this soundtrack but the My Inspiration feature will use it. Some sound file formats may not be supported by this program. Click preview to make sure your sound will work. To learn more about adding your own music, click here.
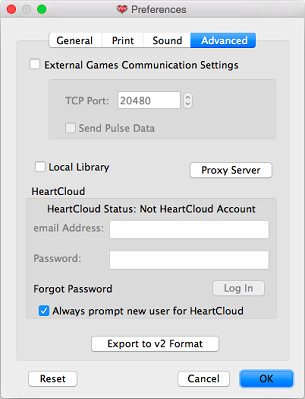
Advanced
Advanced settings are found here. If you are playing an external third party game, you can enable TCP communication for that here. Also, If you find yourself logged out of HeartCloud, you may log back in here: